Why do you need a partner with a strong online system?
To take a full advantage of the Service Excellence projects, we as a provider need an online solution rich of opportunities to find and guide shoppers and validate their job or gather your client’s feedback plus deliver all this data to you. You as an end-user need a good system to view and analyze the results and make plans for future development steps.
Not every online system is functional enough to make it useful in everyday operations and push your financial and non-financial results up!
Dive Group has an exclusive rights to work with world famous Quality and Service Excellence Software – Shopmetrics. Specially for our markets and clients adjusted system is called Dive Online.
With the help of this ultimate platform:
- Every stage of your project is registered in our online system, therefore you can observe and use transitional as well as final results of your Company project online
- All the data collected during the project are validated and accessible to you just a few days after a survey
- All the processes concerning customer service management and improvement are integrated in one system! Dive OnLine does not include results of mystery shopping research only: all the services we provide are conducted on the basis of this system
- You are provided with special user name and password and login via the Internet. We provide access to the results to all your entitled to results employees – there are no limits concerning creating profiles and setting the range of information accessible within these profiles
- We guarantee complete security of the data we store – all the information is coded and archived in servers placed in various parts of the world
We welcome you to take a look at System video demonstration
From Scorecards and Dashboards to advanced interactive reports our reporting platform offers unlimited reporting and business intelligence capabilities in one integrated solution
Browse the array of most important tools available for your reporting needs below and discover the flexibility we offer:
- The Welcome Page
- Client Dashboard
- GeoAnalysis
- Aggregate Service Excellence Report
- Reports Portal
- Survey Explorer
- Drill-Down Tree
- Custom Rollups
- Mobil Analytics
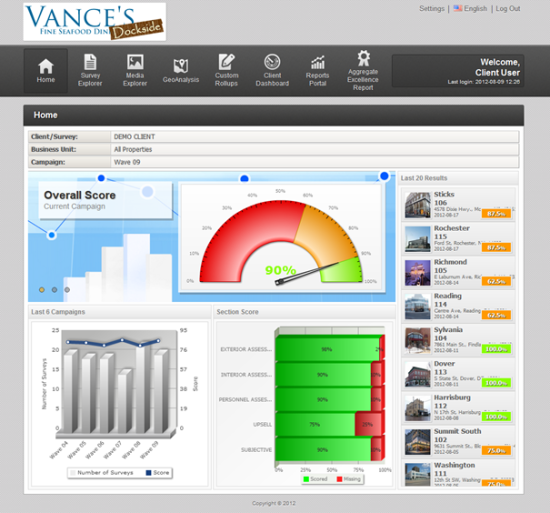
The Welcome Page
The Welcome Page is specially designed to present data aggregated to the highest level at a glance. You can immediately see the overall and section scores of the campaign plus keep track of the trend of your location results.
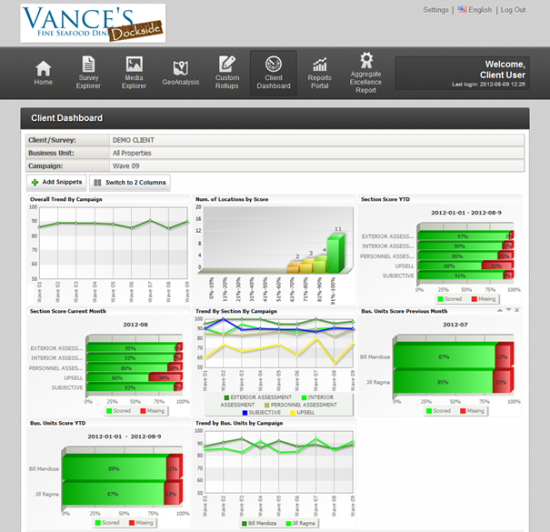
Client Dashboard
Information at a Glance
The Client Dashboard delivers a powerful visual presentation of multiple performance indicators at a glance. With its ability to quickly provide a comprehensive view of the “big picture” with a single click, the Client Dashboard is the perfect tool for high level managers.
- With easy, drag-and-drop user-based customization capabilities, the Client Dashboard is the ultimate top-management “information at a glance” reporting tool.
- The ability to zoom snippets allows you to get a magnified view or simply export to a PowerPoint presentation for an executive meeting.
- Vivid visual markers allow you to quickly identify top and critical performers in various key performance indicators.
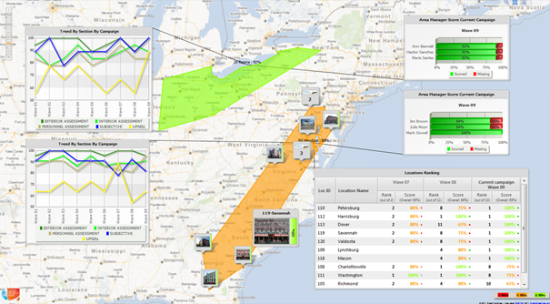
GeoAnalysis
The Ultimate Visual Presentation
The Geospatial Analysis Portal is a unique feature in our analytical platform, enabling data visualization based on geographical regions/districts/locations or other company-specific organizational structures. We offer more than 10 different charting options along with filtering abilities by time/period/campaign (wave); client/project; location/state/region. Multiple charts of the same type can be opened in the same report and each chart can be moved to a different position or resized for better visualization.
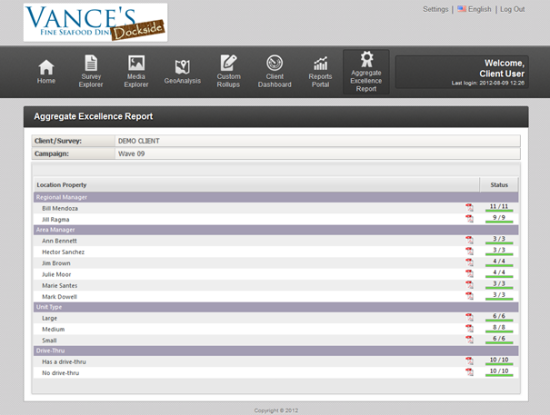
Aggregate Service Excellence Report
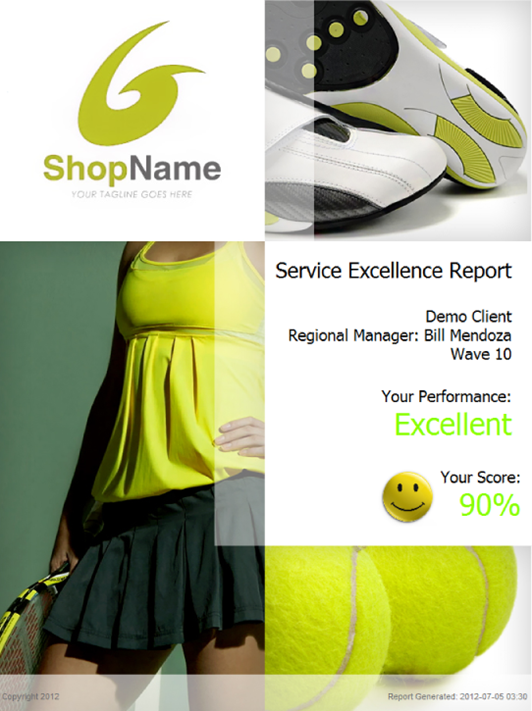
The Aggregate Service Excellence Report is designed to be delivered at different organizational levels – regional managers, area managers, unit type, etc. Its main objective is to deliver comprehensive and easy to follow and read performance analysis, by displaying the performance results in the context of organizational objectives, past performance and in comparison with peers. It also identifies the most critical performance areas (Attention Areas) and explains how focusing on these areas will affect overall results.
The report can be scheduled for automated email delivery at a certain date, or after all jobs within the organizational level are completed. The Aggregate Service Excellence Report is fully customizable, allowing you to build your own custom Aggregate Service Excellence Reports giving your client a unique report matching their corporate style:
Reports Portal
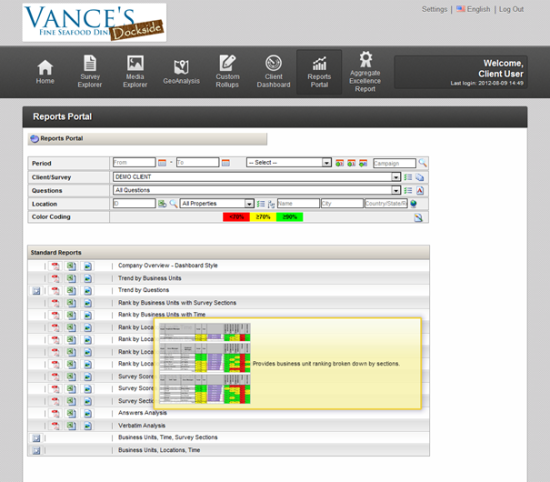
With the combination of the three fundamental data presentation components in one report – tabular, chart and color coding, you benefit from the enhanced visualization and dramatic time savings in reading and understanding reports. You no longer have to expend effort reading and interpreting data, our reports do this for you. With over 15 customizable and configurable reports covering all aspects of organizational performance, including trending, ranking, survey, question and answer analysis, verbatim and exceptions analysis you are guaranteed to have a thorough view of your performance at any point in time and business dimension. All reports are available for download in PDF, Excel and image formats. You can easily copy and paste portions of the report into your PowerPoint presentations.
- Below and above average performers are visually identified in every report.
- Customizable color-coding is available for every dataset.
Survey Explorer
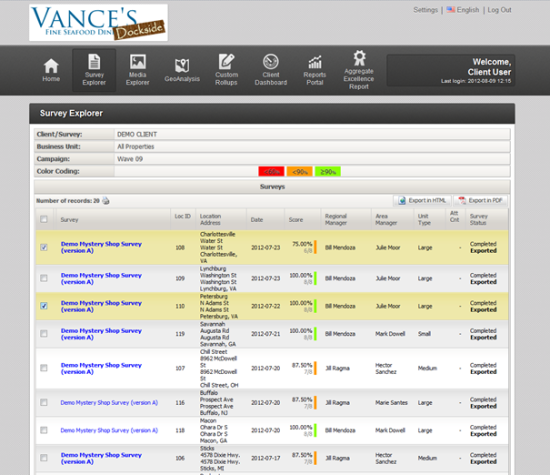
Survey Explorer allows you to search through the list of completed surveys. This functions much like the administrative version of Survey Explorer with the difference that the column headers and survey information is limited to reduce search time and display more results. By default, only surveys that have been validated and approved for delivery to the client are displayed.
Drill-Down Tree
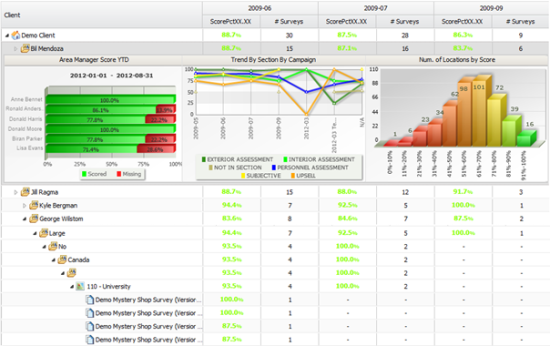
This brand new Reporting Tool will allow you to visualize your client’s Business Structure in order to aggregate and instantly analyze results from the current or previous campaign on any level. Users can generate reporting snippets or entire service excellence reports with only a few clicks whether for an entire Business Unit or an individual Mystery Shop.
Custom Rollups
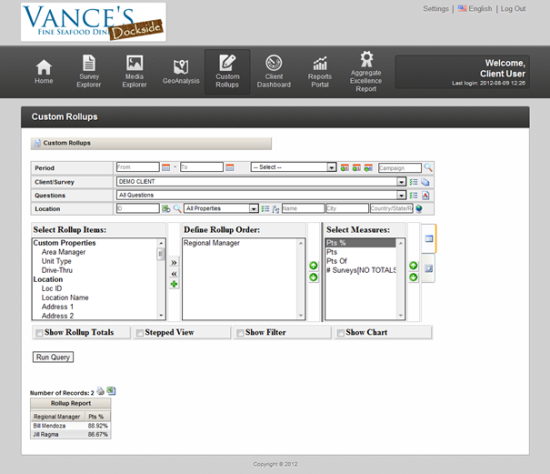
If the standard reports do not satisfy your more specific reporting requirements, our Custom Report builder is the perfect tool for you. The quick, three step report generation tool is a convenient way to construct custom datasets on the fly with minimum time and effort. Simply filter the data you are interested in, select the items to appear on the report, define the order and run the report. Once the report is generated, you can export it to Excel or print preview it.
Advanced filtering by:
◦ Time/Period
◦ Campaign (Wave)
◦ Client/Project
◦ Location/City/State/Region
- Select between tabular and cross-tab view.
- Define your Report – select from over 100 data items and sort them in the desired order.
Mobil Analytics
Any place, any time, any device
Business users live on their mobile handheld smartphones and spend less and less time on their computers. Mobile Analytics makes data available to users when they need it and have time to review it: while travelling, waiting for a meeting to start, or the moment new results are published online.
Mobile Analytics works like a “do-it-yourself” magazine: subscribe to content that is relevant to you and synchronize it with your smartphone. Once synchronized, you can access your results even if you do not have internet access, for example, when you fly on a plane.
